A Blue And Yellow Flow Chart That Illustrates The Process Of Hydrogen Delivery
Description
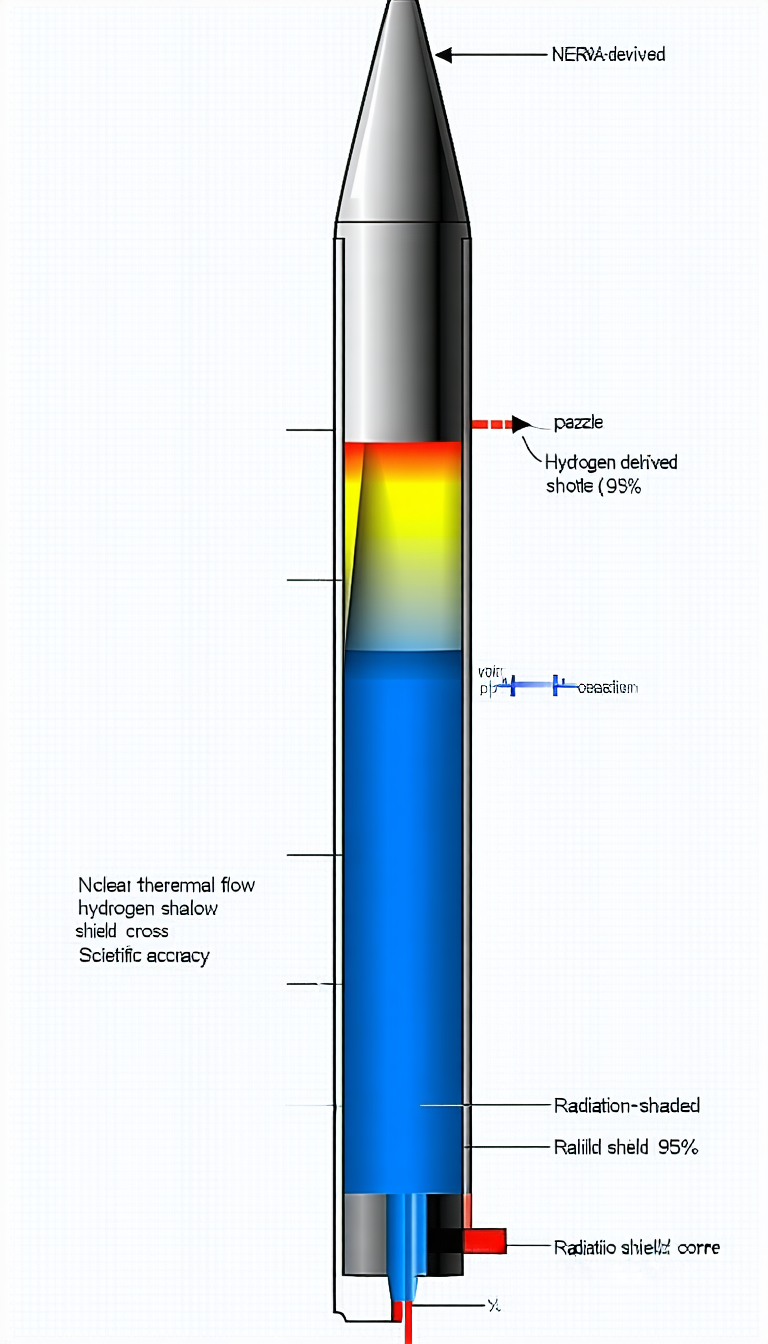
The image shows a blue and yellow flow chart that illustrates the process of hydrogen delivery. The chart is divided into several sections, each representing a different stage of the process. The flow chart is labeled with various terms, such as "hydrogen delivered" and "hydrogen shield." The chart is organized in a way that allows for easy understanding of the process. The different stages are clearly marked, making it a useful tool for explaining the intricacies of hydrogen delivery.
Image Details
Resolution
768 × 1344
File Size
940.6 KB
Style
Not specified
SEO URL
a-blue-and-yellow-flow-chart-that-illustrates-the-process-of-hydr-1745627456